


This program calculates a meeting point where the emissions of the flights to it are minimal. I am aware that it might not be 100% obvious what exactly the program does just yet but I hope it will be clearer after an example: If a company has offices in multiple countries and wants to have a meeting with participants from each office, this program is able to calculate the airport to which the combined CO2 emissions are minimised.
How does it work?
The geodesic median
All start points are passed to the geodesic median function. This function then calculates the point, to where to sum of the distances is minimal. There is a direct connection between emissions and distances flown. Therefore this is a good start for further calculations. This Twitter thread I wrote further explains how the algorithm works.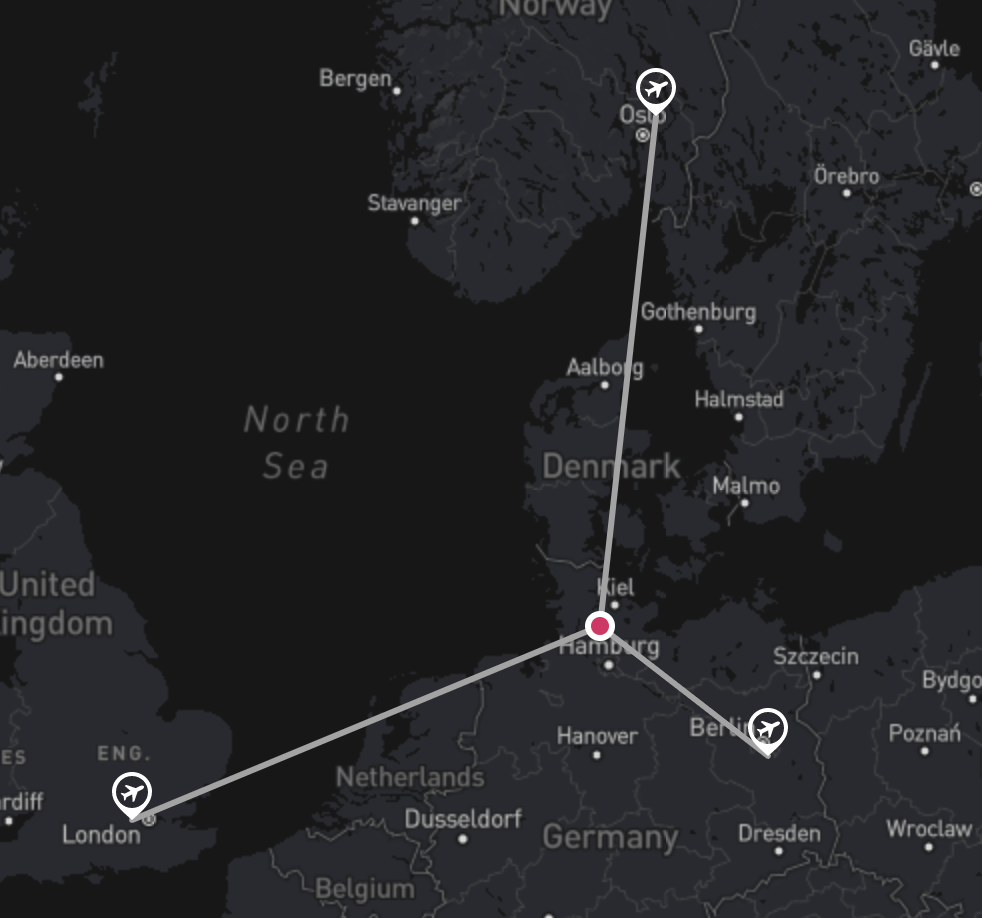
Considering long-haul flights
For short/medium-haul flights the geodesic median can be calculated with even weights for each start point. Yet, if a long haul trip is included, the goal is to minimize the distance of this flight, while keeping the number of long haul flights minimal. This is important because the airplanes used for long-haul flights usually emit more than twice the amount of CO2 than the airplanes used for short/medium-haul flights. So if there is a long-haul flight, the meeting point is recalculated using weights and certain stoppers to ensure minimal emissions.
Find the closest Airports
The meeting point has to be an airport since airplanes can't land anywhere. I have written a function that calculates the n closest airports to any coordinates in the world. It uses the haversine formula and an array of all commercial airports.
Calculate emissions and distances
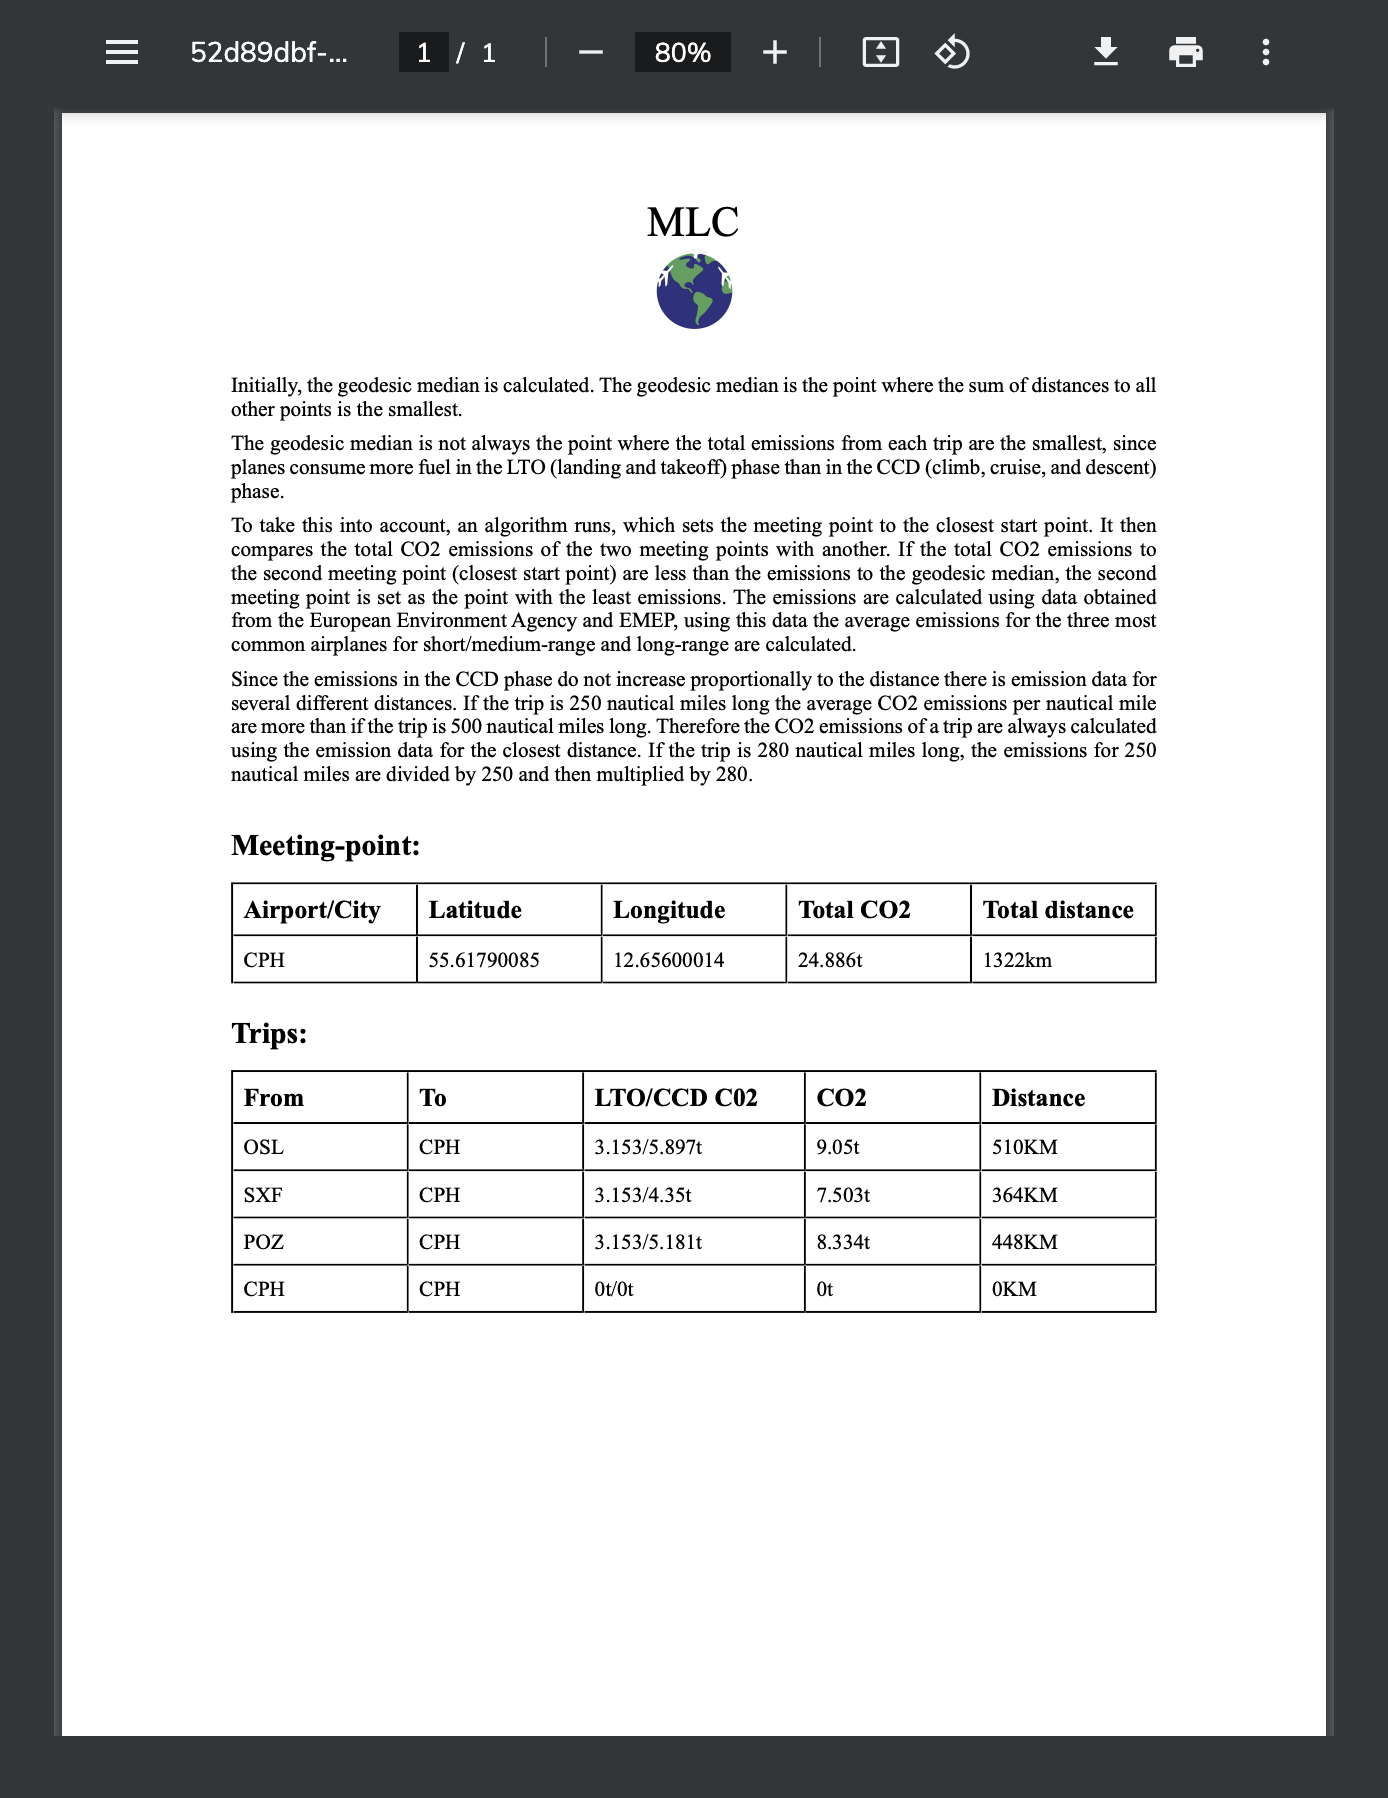
The calculated meeting point (airport) is then passed into a function that calculates CO2 emissions and distances for every flight to the median point from the start points. Finding good data was the most complicated part of this function. Eventually I found a dataset with the emission data for almost every airplane there is. However I don't know the exact airplane model for every trip, so I had to figure out which airplanes are the most popular for short, medium and long haul flights. I then calculated the average emeissions for each category.
I also added a PDF functionality using react-pdf to enable the user to save and export more detailed information about the trips.
What did I learn?
What I learned about the most was geometry and how to find good data. A big part of the project was reading papers, researching for data, and validating this data.
I also learned about working with maps, longitude/latitude, and spheres. More precisely I learned about the Leaflet library.
Concluding thoughts
This is my most complicated project until now, but also the one I enjoyed working on the most. I really like how it has a direct connection to the real world and how it can solve a real problem. I wished I would have had access to an API to get more detailed information about emissions, routes, and airplane model but for this I would need direct contact with an aviation company or enough budget for one of their APIs.